Background of R analysis methods
This section describes the R analysis methods utilized in this analysis at a conceptual level, with later pages explaining the analysis in more detail.
Initial data loading and preprocessing of data from raw sources
The analysis requires integration of data from multiple sources, as explained in the graphic below:

At a high level, each source contributed the following:
- CDC AtlasPlus provided county-level estimates of the number of people living with HIV. These data formed the basis for the HIV burden estimates used throughout the analysis.
- U.S. Census Bureau / American Community Survey (ACS) provided tract- and county-level population denominators used to estimate how HIV burden might be distributed within counties.
- Census TIGER/Line shapefiles provided the geographic boundary files for counties, census tracts, and other map layers used in spatial processing.
- HRSA transplant center data provided the geographic locations of transplant centers.
- SRTR data were used to classify transplant centers according to center characteristics relevant to this study.
- Mapbox isochrone and routing tools were used to estimate travel-time catchment areas around transplant centers.
Extrapolation of county HIV population to the census tract level
The CDC Atlas database provides HIV prevalence estimates at the county level. We used a straightforward mathematical interpolation to estimate the number of people living with HIV for each census tract:
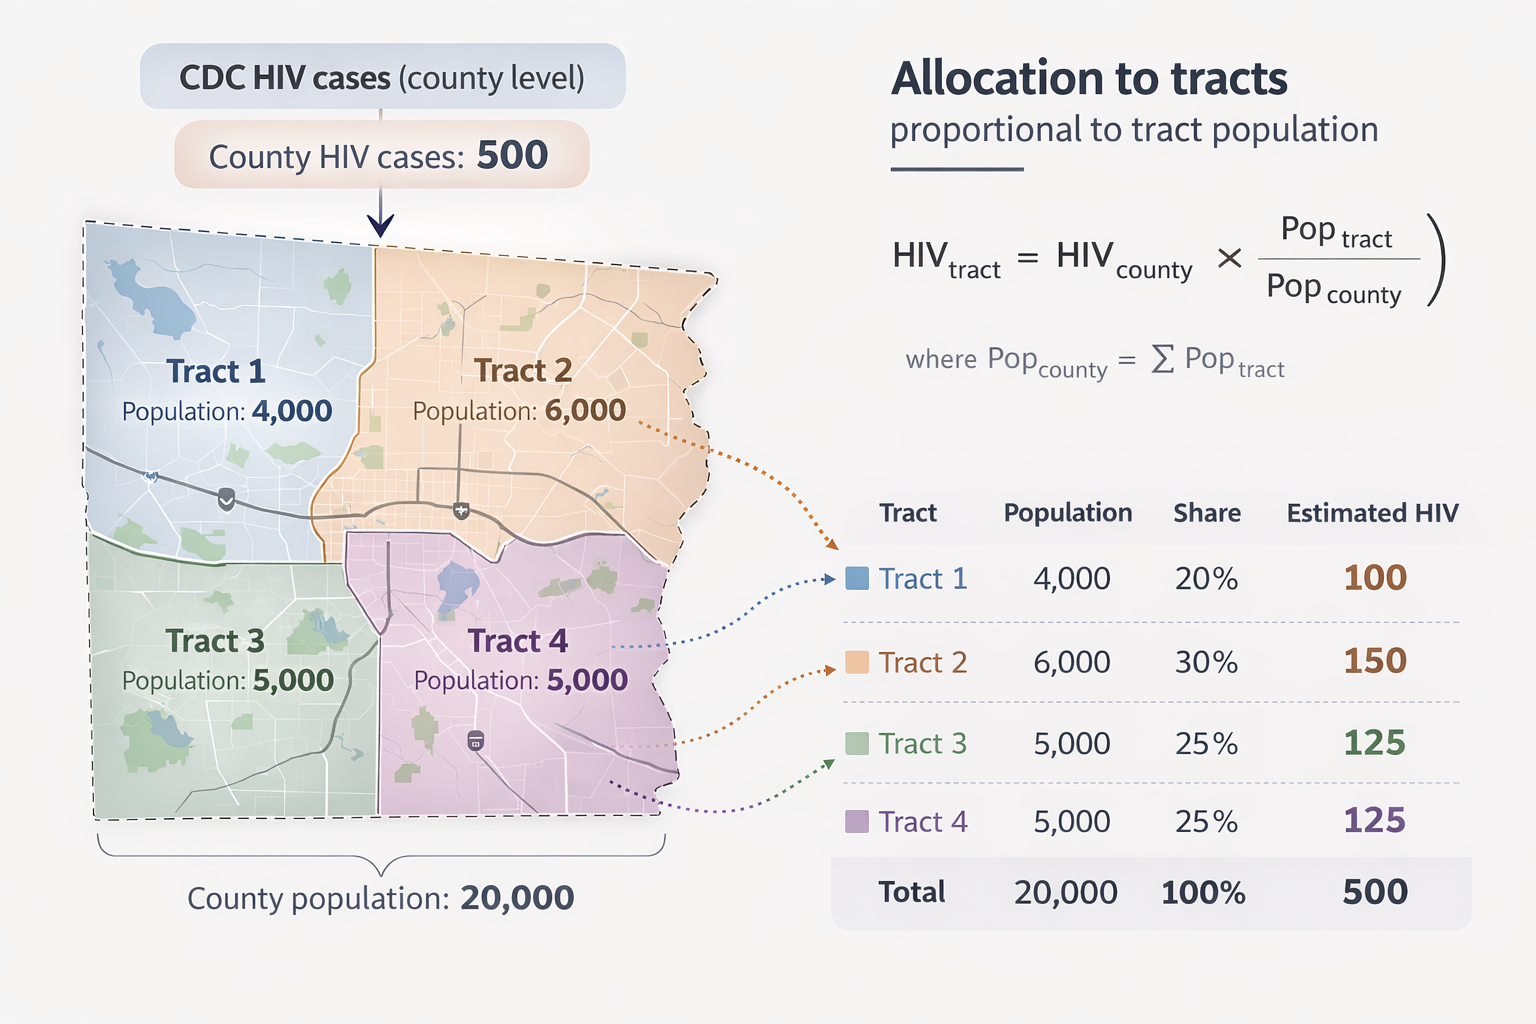
Because CDC AtlasPlus provides HIV prevalence estimates at the county level, tract-level counts were approximated by allocating county case counts in proportion to tract population. This produces crude tract-level estimates, but should introduce limited error in aggregated analyses when catchment boundaries tend to encompass most or none of a county’s high-burden tracts. In future work, we plan to evaluate stratified or population-weighted areal interpolation instead.
Geospatial methods in R
Geospatial processing for this analysis was conducted in R, using the sf package as the primary framework for spatial data management and analysis. The geospatial approach closely follows the methods outlined in Analyzing US Census Data: Methods, Maps, and Models in R, which provides a practical foundation for working with Census geography in R.